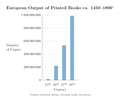
Datoteka:European Output of Books 500–1800.png

Stranica ne postoji na drugim jezicima.
Izvor: Wječnik

Vidi sliku u punoj veličini(1.436 × 953 piksela, veličina datoteke: 64 KB, MIME tip: image/png)

Ova datoteka je s projekta Zajednički poslužitelj i mogu je koristiti drugi projekti. Opis s njezine stranice s opisom datoteke prikazan je ispod.

Sažetak

Opis
Deutsch: Geschätzte europäische Buchproduktion von 500 bis 1800. Bei den Manuskripten sind einzelne Urkunden und Chartas nicht berücksichtigt. Ein gedrucktes Buch ist definiert als ein Druckwerk von mehr als 49 Seiten.
English: Estimated European output of books from 500 to 1800. Manuscripts do not include individual deeds and charters. A printed book is defined as printed matter containing more than 49 pages.
Datum
Izvor

Vlastito djelo postavljača

Data from: Buringh, Eltjo; van Zanden, Jan Luiten: "Charting the “Rise of the West”: Manuscripts and Printed Books in Europe, A Long-Term Perspective from the Sixth through Eighteenth Centuries", The Journal of Economic History, Vol. 69, No. 2 (2009), pp. 409–445 (416–417, tables 1&2)
Autor Tentotwo
Ostale inačice
This graph image could be re-created using vector graphics as an SVG file. This has several advantages; see Commons:Media for cleanup for more information. If an SVG form of this image is available, please upload it and afterwards replace this template with {{vector version available|new image name}}.


It is recommended to name the SVG file “European Output of Books 500–1800.svg”—then the template Vector version available (or Vva) does not need the new image name parameter.

LaTeX source

\documentclass[border=5mm]{standalone}
\usepackage{pgfplots}
\usepackage[super]{nth}
\usepackage{amsmath}
 
 
\pgfplotstableread{
Siglos Manuscritos Libros impresos
6       13552           nan
7       10639           nan
8       43702           nan
9       201742  nan
10      135637  nan
11      212030  nan
12      768721  nan
13      1761951 nan
14      2746951 nan
%15   4999161 12589000
16       nan            217444000
17      nan             531941000
18      nan             983874000
}\datatable
 
\definecolor{RYB1}{RGB}{128, 177, 211}
\definecolor{RYB2}{RGB}{253, 180, 98}
 
\begin{document}
\begin{tikzpicture}
\begin{semilogyaxis}[
        axis on top=false, grid=both, xmajorgrids=false, every minor grid/.style=gray!20,
        axis lines*=left,
        width=12cm, height=8cm, enlarge x limits=0.05,
        ymin=1000, ymax=1e9,ytick={1000,1e4, 1e5, 1e6, 1e7, 1e8, 1e9},
        yticklabels={1000, 10\,000, 100\,000, 1\,000\,000, 10\,000\,000, 100\,000\,000, 1\,000\,000\,000},
        enlarge y limits=false,
        ybar=-10pt, xtick={6,...,18}, xticklabel={\pgfmathparse{int(\tick)}\nth{\pgfmathresult}},
        xlabel=Siglos, xlabel style={yshift=-1ex},ylabel=Número\\ de Copias,
        ylabel style={rotate=-90, align=left, anchor=east, xshift=-4ex, name=ylabel},
        after end axis/.code={
                \node [
                        font=\large\bfseries,
                        text=RYB2!60!black, fill=white, fill opacity=0.85, text opacity=1,
                        anchor=center, inner xsep=1pt]  at (axis cs:11,5e3) {Manuscritos};
                \node [
                        font=\large\bfseries, inner xsep=1pt,
                        text=RYB1!60!black,
                        fill=white, fill opacity=0.85, text opacity=1,
                        align=center, anchor=center]  at (axis cs:16.6,5e3) {Libros impresos};\
        },
        title={Producción Europea occidental de libros entre los años 500 y 1800$^{\text{\tiny{*}}}$},
        title style={font=\large\bfseries, align=center}
        ]
 
        \addplot +[fill=RYB1, draw=RYB1!50!black] table [y=Books] {\datatable};
        \addplot +[fill=RYB1, draw=RYB1!50!black, /pgf/bar shift=2.5pt] coordinates {(15,12589000)};
        \addplot +[fill=RYB2, draw=RYB2!50!black] table {\datatable};
        \addplot +[fill=RYB2, draw=RYB2!50!black, /pgf/bar shift=-2.5pt] coordinates {(15,4999161)};
        \draw (rel axis cs:0,0) -- (rel axis cs:1,0);                 
\end{semilogyaxis}
\node (annotation) at (current axis.below south west) [inner xsep=0pt, anchor=north west, align=left, font=\tiny] {$^*$without Southeast Europe (Byzantine, later Ottoman realm) and Russia};
 
\end{tikzpicture}
\end{document}

Licencija

Ja, nositelj autorskog prava za ovo djelo, ovime ga objavljujem pod sljedećom licencijom:
w:hr:Creative Commons
imenovanje autora dijeli pod istim uvjetima
Slobodno smijete:
  • dijeliti – umnožavati, distribuirati i javnosti priopćavati djelo
  • remiksirati – prerađivati djelo
Pod sljedećim uvjetima:
  • imenovanje autora – Morate pripisati odgovarajuće autorske zasluge, dati poveznicu na licenciju, te naznačiti jesu li načinjene promjene autorskog djela. Prethodno navedeno možete učiniti na svaki razuman način, ali ne na način koji bi sugerirao da Vi ili Vaše korištenje licencorova djela ima izravno licencorovo odobrenje.
  • dijeli pod istim uvjetima – Ako ovo djelo izmijenite, preoblikujete ili stvarate na osnovu tog materijala, svoje doprinose morate distribuirati pod istom ili kompatibilnom licencijom kao što je i licencija originala.

Opisi

Dodajte kratko objašnjenje što predstavlja ova datoteka

Predmeti prikazani u ovoj datoteci

motiv

15. prosinca 2011

Povijest datoteke

Kliknite na datum/vrijeme kako biste vidjeli datoteku kakva je tada bila.

Datum/VrijemeMinijaturaDimenzijeSuradnikKomentar
sadašnja04:41, 22. prosinca 2011.Minijatura za inačicu od 04:41, 22. prosinca 2011.1.436 × 953 (64 KB)TentotwoRemoved source text from image
05:53, 16. prosinca 2011.Minijatura za inačicu od 05:53, 16. prosinca 2011.1.455 × 953 (73 KB)TentotwoImproved formatting
02:38, 15. prosinca 2011.Minijatura za inačicu od 02:38, 15. prosinca 2011.1.260 × 799 (87 KB)Tentotwo

Nijedna stranica ne rabi ovu datoteku.

Globalna uporaba datoteke

Sljedeći wikiji rabe ovu datoteku: